Meta
Data Visualization
Design System
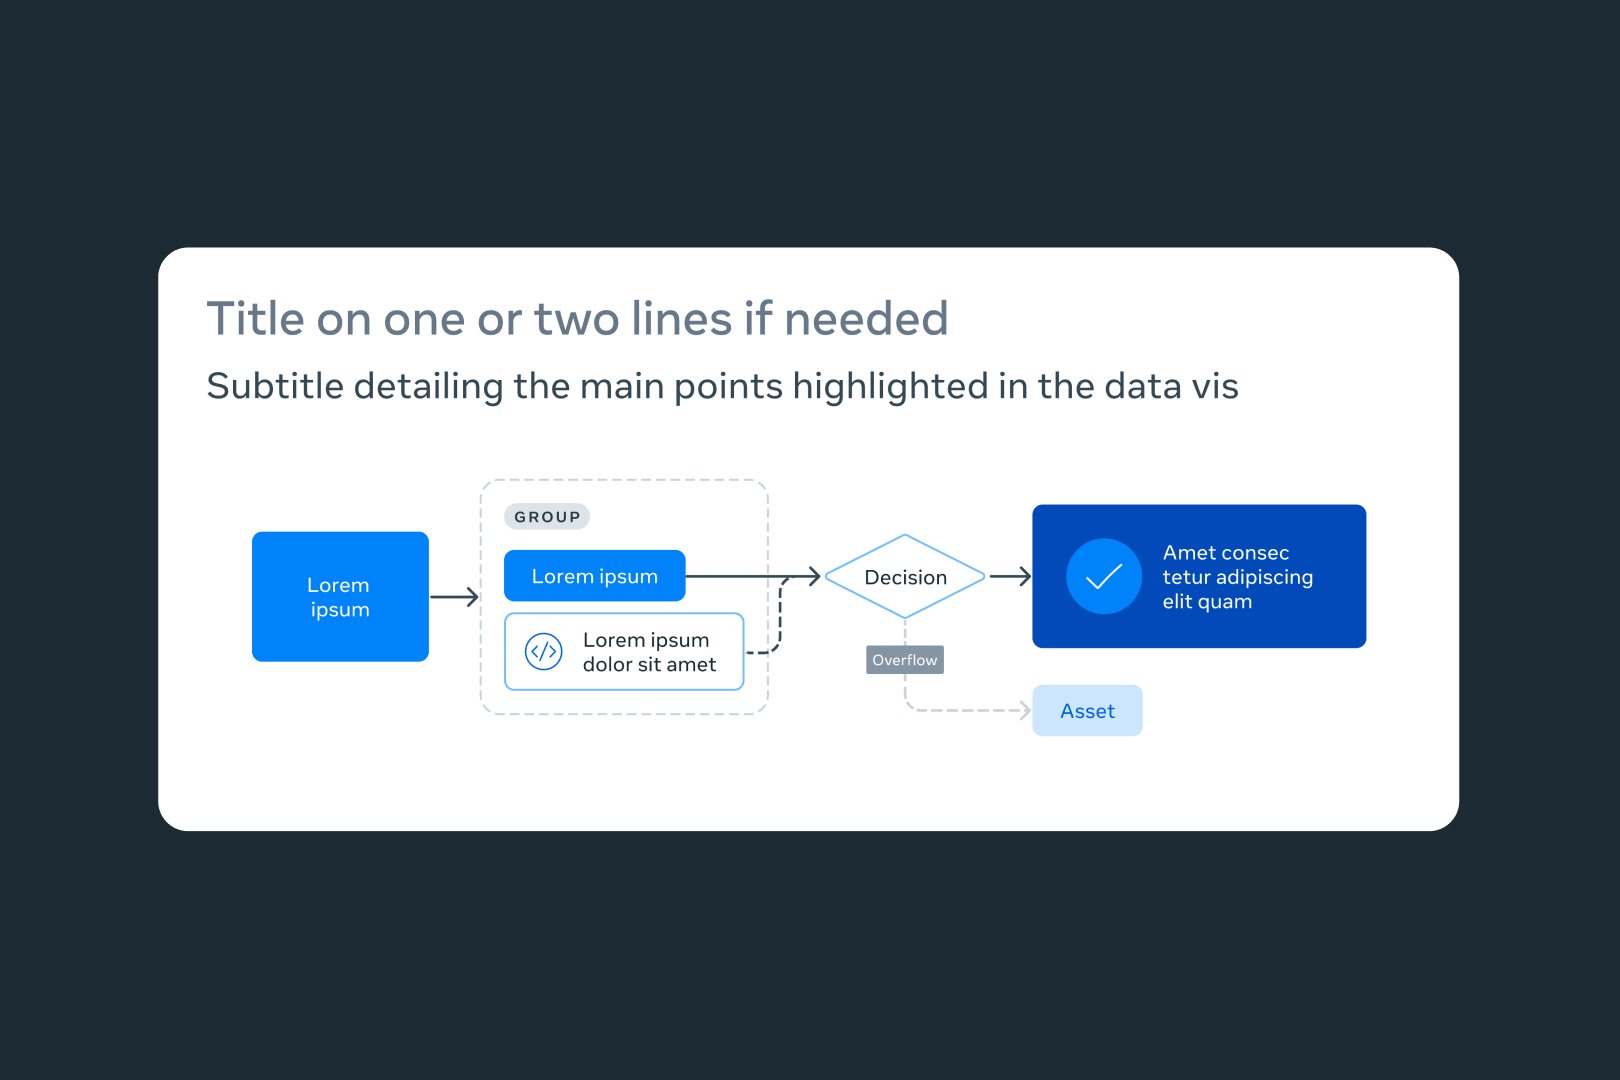
At Meta, we frequently use data visualizations and flow charts to communicate our strategies, research and results to the public through our owned social media and web channels. However, these visual aids can often be difficult to understand, so it's critical that they are as clear and accessible as possible, while also staying true to the Meta brand. Additionally, with so many teams creating these visuals at scale, it was becoming challenging to maintain visual consistency.
Art Direction
Design

Opportunity
I recognized an opportunity to streamline this process by creating a design system and library of templates, to aid in the creation of these visuals and ensure a unified look and feel across all teams.

Results
Our design system and templates were met with great enthusiasm and quickly adopted throughout the design department. It's no surprise, as they helped significantly reduce the design time for a single flow chart from 1 hour to just 10 minutes.

Figma Design System

Creative Direction - Carolyn Anderson